OC search
The user can search ortholog clusters (OCs) by gene ID (KEGG GENES ID), OC cluster ID, and annotation terms.
In the case of GENES ID and OC cluster ID, the user obtains the list of genes contained in the OC cluster.
In the case of annotation terms, the user obtains the list of OC clusters that include genes associated with the query annotation terms. Clicking on one OC cluster ID, the user obtains the list of genes in the specified OC cluster. The two numbers after the OC identifier mean 1) the number of genes whose annotations include the query term and 2) the total number of genes in the corresponding OC. For example, "OC.xxx (aa/bb)" means that the genes associated with the query term are present in cluster OC.xxx, the cluster OC.xxx contains bb genes in total, and aa out of bb genes have the query terms in their annotations.
Search results
Sequence list of OC cluster
The ortholog clusters (OCs) in KEGG OC are hierarchically structured along a phylogenetic tree. The output table shows the contents of one OC cluster, which includes putative orthologous genes in the OC and the associated gene annotations. "OC Root" is the identifier of the corresponding OC cluster. "PC" means paralog cluster, which include putative paralogous genes in each organism.
Taxon-based OCs are shown between OC Root and PC. The OC of higher taxon (resp. lower taxon) is shown on the left side (resp. right side) of the output table. Note that the depth of taxon-based OCs is not constant, because phylogenetic hierarchy differs from organism to organism.
Clicking the hyperlink of the KEGG GENES ID, the user can jump to the corresponding entry in KEGG GENES. Clicking any cell of the column of the output table, the user can refine the result using the corresponding OC cluster as a query.
Refinement of cluster
 The ortholog clusters (OCs) obtained for a query can be refined by using the slider. The slider knob is located on the left extreme and the corresponding OC depth is 1 by default. Dragging the slider right (resp. left), the OC of lower taxon (resp. higher taxon) is shown. Dragging the slider up to the extreme right, the paralog cluster (PC) including the query gene is shown. Biological validity of the OCs is not guaranteed, because KEGG OC is constructed in an automated process without manual curation. Thus, the OC Viewer provides an option to refine the result of gene clustering.
Organism selection
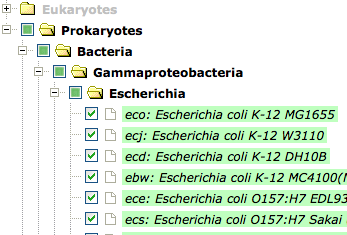 All organisms in KEGG GENES used for calculating the OCs are shown according to the hierarchy of KEGG Organisms. The organisms included in the OC can be chosen, but the other organisms cannot be chosen (the organism/taxon names are displayed).
Clearing the checkboxes for organisms, the genes of the corresponding organisms disappear. This option can be used for removing unwanted organisms or for specifying organisms of interest.
Plain text of OC cluster
The user can view or download the text file of the obtained OC table in the tab-separated value (TSV) format. The user can obtain the table only for OC Root (OC depth is 1). The current version of the OC Viewer does not support the download of the refined OC table.
Algorithms for constructing KEGG OC
Amino acid sequence similarity data
We used the KEGG SSDB (Sequence Similarity DataBase), which contains the information about amino acid sequence similarities among all protein-coding genes in the complete genomes in KEGG. The similarities were computed by the SSEARCH program, and the Smith-Waterman similarity scores, symmetric similarity measures, were stored in SSDB. In this study we focus on gene pairs whose Smith-Waterman scores are equal to or greater than 150.
An overview of our proposed method to construct OCs
We propose a new method to cluster all possible genes in all complete genomes based on the Smith-Waterman (SW) scores. The method has several characteristics such as hierarchical gene clusters, pruning of similarity relationships, and quasi-clique-based clustering. They all contribute to determining the boundaries of clusters in a flexible manner without excessively depending on a fixed cut-off value of similarity.
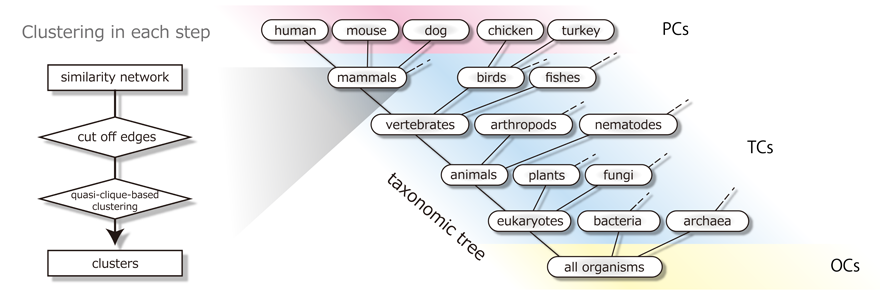
According to the steps listed below, starting with generating gene clusters at the organism level, the method recursively iterates to merge the gene clusters at lower taxonomic levels into the ones at higher taxonomic levels along the hierarchy of taxa provided in the KEGG Organisms. We refer to the clusters at the organism level as paralog clusters (PCs) and the clusters at each taxonomic level as taxon clusters (TCs). The top-level clusters constructed by merging domain-level taxon clusters (eukaryotes, bacteria, and archaea) are called ortholog clusters (OCs). At each level, clusters are numbered and uniquely identified by a pair of the taxon name and the number. All the clusters at lower taxonomic levels belong to exactly one single cluster at each of their higher taxonomic levels and are linked to each other.
At each taxonomic level, before generating clusters by aggregating their members, we carry out pruning of similarity relationships among candidates of members. The pruning is carried out based on the idea of in- and out-paralogs used in the InParanoid algorithm. With respect to each of genes, PCs, and TCs in a taxonomic level, all the intra-taxon similarities lower than its highest inter-taxon similarity are excluded from the similarity dataset. By this pruning, an appropriate threshold for each gene and gene cluster can be introduced in each taxonomic level instead of a fixed cut-off value of the SW scores. The subsequent clustering procedure is carried out by using the quasi-clique-based clustering (QCC), a newly developed algorithm for this purpose, to elastically determine the boundaries of clusters by relaxing the condition required in a clique.
The method is divided into the following three steps:
Step 1. Construction of paralog clusters (PCs). In each organism, after applying the InParanoid algorithm, we group genes by using the quasi-clique-based clustering (QCC). The resulting clusters are referred to as paralog clusters (PCs). PCs are used as the initial taxon clusters (TCs) in the recursive construction of gene clusters along the taxonomic tree in the next step.
Step 2. Construction of taxon clusters (TCs). In each taxon defined in the KEGG Organisms, we aggregate the TCs obtained in the lower taxa into clusters. The similarity between TCs is defined by the minimal similarity score of genes between TCs. In a similar way as in construction of PCs, after the pruning of the similarity relationships by comparing the intra- and inter-taxon similarities, we group TCs by using QCC to generate TCs in the higher taxon. We repeat this QCC operation to cluster the newly generated TCs in a recursive way from lower taxa to higher taxa along the taxonomic tree until all the taxa in each domain are merged.
Step 3. Construction of ortholog clusters (OCs). We aggregate the domain-level TCs into clusters at the putative root level of the taxonomic tree. We group TCs that share enough similarity (with the minimal SW score equal to or greater than 200) across three domains by using QCC. The resulting clusters in this final step are referred to as ortholog clusters (OCs). Note that we cannot carry out the pruning of similarity relationships based on intra- and inter-taxon similarities, since out-groups are not available at this level.
In summary, the proposed method provides us with three types of gene clusters: 1) paralog clusters (PCs) at the level of each organism (e.g., human, chicken, fruit fly, Escherichia coli K-12 MG1655, Methanocaldococcus jannaschii), 2) taxon clusters (TCs) at the level of each taxon (e.g., mammals, birds, insects, Gammaproteobacteria, Euryarchaeota), and 3) ortholog clusters (OCs) at the level of all organisms from three domains (eukaryotes, bacteria, and archaea). Note that all the TCs and their hierarchical relationships can be viewed in OC Viewer with arbitrarily specifying the depth in the taxonomic tree.
Quasi-clique-based clustering (QCC) used in each step
To construct the KEGG OC database, we developed a heuristic clustering algorithm, which we name quasi-clique-based clustering (QCC) after p-quasi complete graph. The QCC algorithm elastically determines the boundaries of clusters by relaxing the condition required in a clique (i.e., all the nodes should be connected to each other in a sub-network) and is used for aggregating genes (in Step 1) and gene clusters (Steps 2 and 3) into their clusters.
The QCC algorithm consists of the following four steps:
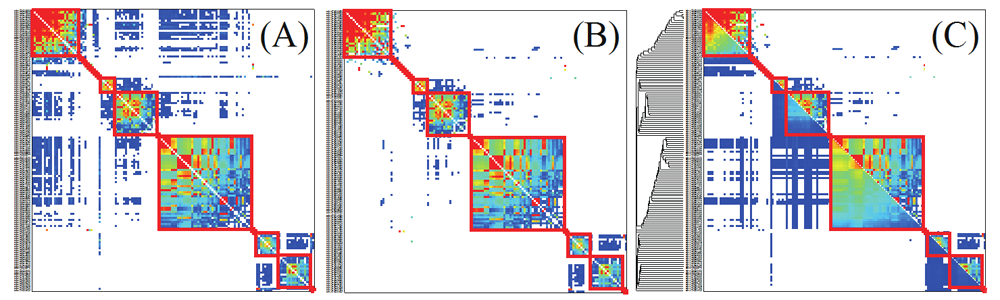
First, we construct a similarity network among all the candidates of cluster members (genes or gene clusters) and divide it into connected components (sub-networks) in each of which nodes are connected by similarity relationships with the SW scores. Note that nodes belonging to different connected components are not connected by similarity relationships. The following steps are therefore carried out in the connected components independently. Figure B shows an example of a connected component in a similarity network among genes of Arabidopsis thaliana represented by an adjacency matrix of genes (nodes). In the adjacency matrix, nodes are aligned in the same order along both the vertical and the horizontal axis, and cells in the matrix show the similarity of between the nodes. Based on the similarity values equal to or greater than 150 (Figure A), the node pairs that have not pruned are colored from blue to red (red cells show higher similarities). The similarities of gene pairs that are not connected (whose similarity is less than 150 or pruned) are set to zeros and not colored in the matrix.
Second, we define a similarity vector called Ågneighbor profileÅh for each node in the similarity network, where each element of the neighbor profile corresponds to the similarity between the node and the other node. In the adjacency matrix representation of a similarity network, each row vector or each column vector in the matrix corresponds to the neighbor profile for each node. Note that square blocks on the diagonal line show cliques and the neighbor profiles of nodes in the same clique are similar to each other (Figure B). This means that we can extract cliques using the similarity among neighbor profiles.
Third, we evaluate the similarity between two neighbor profiles by computing their inner product. Based on the computed neighbor profile similarities, we carry out a hierarchical clustering and obtain the dendrogram of the nodes. The lower left triangle of the matrix in Figure C shows the neighbor profile similarities (red cells show higher values). The resulting dendrogram is shown on the left side of the matrix in Figure C.
Finally, we traverse the dendrogram from the leaves toward the root and recursively iterate to aggregate the nodes in the left and right sub-trees at each branch on the leaf-to-root path, if p = 50% of all the pairs of genes in different sub-trees are connected by the similarity relationships (SW scores) that have not been pruned. If the condition is not satisfied, we stop further traversing from the branch. As the result, we have quasi-cliques that are represented as square blocks on the diagonal line of the matrix. If we set p = 100%, ordinary cliques are obtained, where all the nodes are completely connected to each other. In Figure C, the square blocks corresponding to quasi-cliques are indicated by red solid lines (the same square blocks are also indicated in Figures A and B).
Reference
Nakaya A, Katayama T, Itoh M, Hiranuka K, Kawashima S, Moriya Y, Okuda S, Tanaka M, Tokimatsu T, Yamanishi Y, Yoshizawa AC, Kanehisa M, Goto S. ; KEGG OC: a large-scale automatic construction of taxonomy-based ortholog clusters. Nucleic Acids Res. (2013). [NAR] [PubMed]
Old versions
|
2018-10-29 |
|
|
Feedback
Please use the feedback page to send your comments or questions.