What is TSEG?
Contents
 How to Analyze Membrane Proteins Using TSEG system?
Algorithm of Detection Tool of Membrane Proteins in Genome Sequence
Algorithm of TSEG
Accuracy of TSEG
References
 How to Analyze Membrane Proteins Using TSEG system?
To predict transmembrane segments in query protein sequences,
use the page named "Executing TSEG".
At the top of the page, select the number of discriminant functions to use,
namely 5 or 1. Using 5 discriminant functions, you can get better prediction
results, especially for 5 and 7 transmembrane proteins. But prediction using
5 discriminant functions are rather slow for long sequences (longer than about
1500 amino acids). (See also algorithm of TSEG)
Enter the sequences in the next window. Fasta format is available.
Or you can also specify a file of fasta sequences on your local disk.
In case you want to know which are transmembrane proteins
in a multiple seqnuences like all ORFs in a genome, I strongly recommend to
use the page named "Tool for Detecting Membrane Proteins in Genome Sequence" .
In the page, at first, transmembrane proteins are identified much faster
methods (but not position of transmembrane segments in the sequences).
If you want to have the prediction of position of transmembrane segments
afterwards, TSEG is executed by clicking the ID of an identified transmembrane
protein.
[Top]
Algorithm of Detection Tool of Membrane Proteins in Genome Sequence
The discriminant function is used which was constructed to discriminate
the most hydrophobic 17 residue-long segments in sequences from 2 groups
of the training set, membrane proteins and globular proteins.
The training set of membrane proteins consists of 3250 sequences of membrane
proteins. Every pair of the sequences has less than 30% sequence identity.
The training set of globular proteins are 928 sequences from PDBSELECT
May 1997 version. 94.3% of the membrane proteins and 95.2% of the globular
proteins are correctly predicted by the discriminant function.
[Top]
Algorithm of TSEG
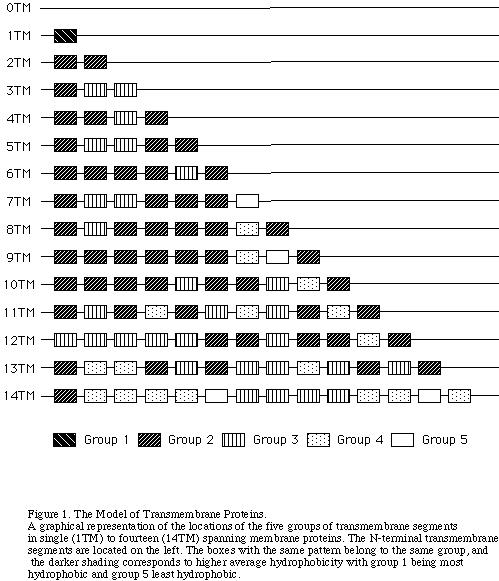
 TSEG is based on a classification of transmembrane(TM) segments.
TM segments in SWISS-PROT database are first devided into subgroups by the
number of TM segments in proteins and the order it spans the membrane. Then
similar subgroups are merged to form 5 groups. Mahalanobis distance was used
as the measure of subgroups, and average hydrophobicity and AP value
(periodicity of alpha helix) are used as parameters to express the
character of subgroups. The location of the 5 groups of TM segments
in 1 TM to 14 TM proteins are shown in Figure 1(the right figure).
The 15 TM proteins (from 0 to 14 TM proteins) are called models of membrane
proteins below.
TSEG is based on a classification of transmembrane(TM) segments.
TM segments in SWISS-PROT database are first devided into subgroups by the
number of TM segments in proteins and the order it spans the membrane. Then
similar subgroups are merged to form 5 groups. Mahalanobis distance was used
as the measure of subgroups, and average hydrophobicity and AP value
(periodicity of alpha helix) are used as parameters to express the
character of subgroups. The location of the 5 groups of TM segments
in 1 TM to 14 TM proteins are shown in Figure 1(the right figure).
The 15 TM proteins (from 0 to 14 TM proteins) are called models of membrane
proteins below.
The linear discriminant function was constructed for each of the
groups of TM segments against the group of loop segments.
A Loop is defined as a segment that is not transmembrane. Thus, the group of
loop regions consisted of all non-transmembrane segments that were longer
than four residues, which was long enough to calculate the AP value,
in the membrane protein sequences of the training data set.
Models (Figure 1) is lines of TM segments in the 5 groups. Therefore, a model
is defined by a combination of multiple discriminant functions.
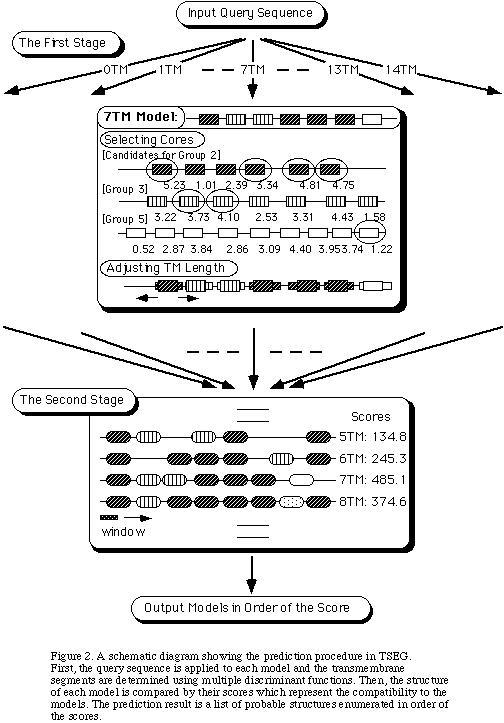
The prediction procedure is illustrated in Figure 2 (the left figure).
In the first stage, a query sequence is applied to each model to see if it is
compatible. When the model is represented only by a single discriminant
function, TM segments are selected in order of their scores. When the model
contains multiple discriminant functions, each function first selects candidate
TM segments independently up to the maximum number allowed by the model,
then the combination that gives the highest score is adopted for the model
avoiding overlapping segments. The selection of TM segments is made by a
window search, where the score for a window is the result of
computing the parameter values and employing the discriminant
function. The window length is set to 17. Those
windows determined to be transmembrane are called _gcores_h of
transmembrane segments. Then the length of each core is adjusted
as follows. The 17 residue window is moved from both ends of the
core toward N- and C-terminal directions until the discriminant
function gives a negative score, which determines outer
boundaries of the transmembrane segment. The final predicted
boundary is taken to be the halfway between the outer boundary
and the core boundary. In case the outer boundaries of
neighboring transmembrane segments overlap, both boundaries are
shortened as much as possible to eliminate the overlap. If the
transmembrane segments obtained are longer than 35 residues,
they are shortened not to exceed 35 residues.
In the second stage, the models are compared by their scores.
The score for each model is the sum of scores for all the
windows in the sequence.
Our method is characterized by the following three features.
The main feature is that different properties of
different TM segments are incorporated based on classification
of TM segments in a database. In fact, not all
TM segments are equally hydrophobic, but some of them
have distinctive features. For example, TM segments
of single spanning membrane proteins are known to be highly
hydrophobic and have small hydrophobic moments, whereas the last
TM segments in seven-transmembrane proteins are relatively less
hydrophobic and are often difficult to detect by prediction methods.
Thus, we have classified TM segments first by the total number of
TM segments in a protein and the order that they appear in the protein
sequence, and then by merging similar ones into groups.
Second, our method enumerates possible models ranked
by their scores where a model is distinguished by the number of TM segments
in a membrane protein.
Even for a membrane protein whose topology is derived by some
experimental evidence, it is often the case that contradictory
results are suggested by other experiments.
Therefore, it is desirable for a predictive method to output not
a single prediction but a list of possibilities with certainty
measures, so that further experiments can be designed to
distinguish between several topology models.
Third, the possibility that the query sequence is
a globular protein is explicitly taken into consideration, which is not
necessarily a feature incorporated in the existing methods.
(See the reference [3] for detail)
[Top]
Accuracy of TSEG
The prediction results to the 89 test sequences using the best parameter set
(average hydrophobicity, AP value, polarity ) are blow.
| Rank |
Protein-based |
Segment-based |
| Obs-sov(%) |
Prd-sov(%) |
Nseg under |
Nseg over |
| top1 |
61.8 |
85.1 |
91.5 |
28 |
53 |
| top2 |
73.0 |
89.9 |
93.8 |
21 |
36 |
| top3 |
74.2 |
92.1 |
95.3 |
16 |
28 |
Rank : Up to 1, 2 or 3 predictions were considered.
Obs / Prd -sov(%) : Obvserved/predicted TM segment overlaps.
Nseg under / over : Number of false positive/negative TM segments.
(See reference [3] for detail )
[Top]
References
[Detection of Membrane Proteins]
[1] Kihara,D., Kanehisa, M.
Detection of Membrane Proteins in the Whole Genome Sequences.
Genome Informatics 1997, pp.300-301, Universal Academy Press,
Tokyo (1997) - [pdf]
[2] Kihara, D., Kanehisa, M.
Tandem clusters of membrane proteins in complete genome sequences. (1999).
( in preparation )
[TSEG]
[3] Kihara,D., Shimizu,T., Kanehisa,M.
Prediction of Membrane Proteins Based on Classification of
Transmembrane Segments.
Protein Engineering 11: 961-970 (1998) - PubMed
[Top]
Back to TSEG homepage
Last updated: March 11, 1999
dkihara@purdue.edu
 TSEG is based on a classification of transmembrane(TM) segments.
TM segments in SWISS-PROT database are first devided into subgroups by the
number of TM segments in proteins and the order it spans the membrane. Then
similar subgroups are merged to form 5 groups. Mahalanobis distance was used
as the measure of subgroups, and average hydrophobicity and AP value
(periodicity of alpha helix) are used as parameters to express the
character of subgroups. The location of the 5 groups of TM segments
in 1 TM to 14 TM proteins are shown in Figure 1(the right figure).
The 15 TM proteins (from 0 to 14 TM proteins) are called models of membrane
proteins below.
TSEG is based on a classification of transmembrane(TM) segments.
TM segments in SWISS-PROT database are first devided into subgroups by the
number of TM segments in proteins and the order it spans the membrane. Then
similar subgroups are merged to form 5 groups. Mahalanobis distance was used
as the measure of subgroups, and average hydrophobicity and AP value
(periodicity of alpha helix) are used as parameters to express the
character of subgroups. The location of the 5 groups of TM segments
in 1 TM to 14 TM proteins are shown in Figure 1(the right figure).
The 15 TM proteins (from 0 to 14 TM proteins) are called models of membrane
proteins below.