
About DINIES
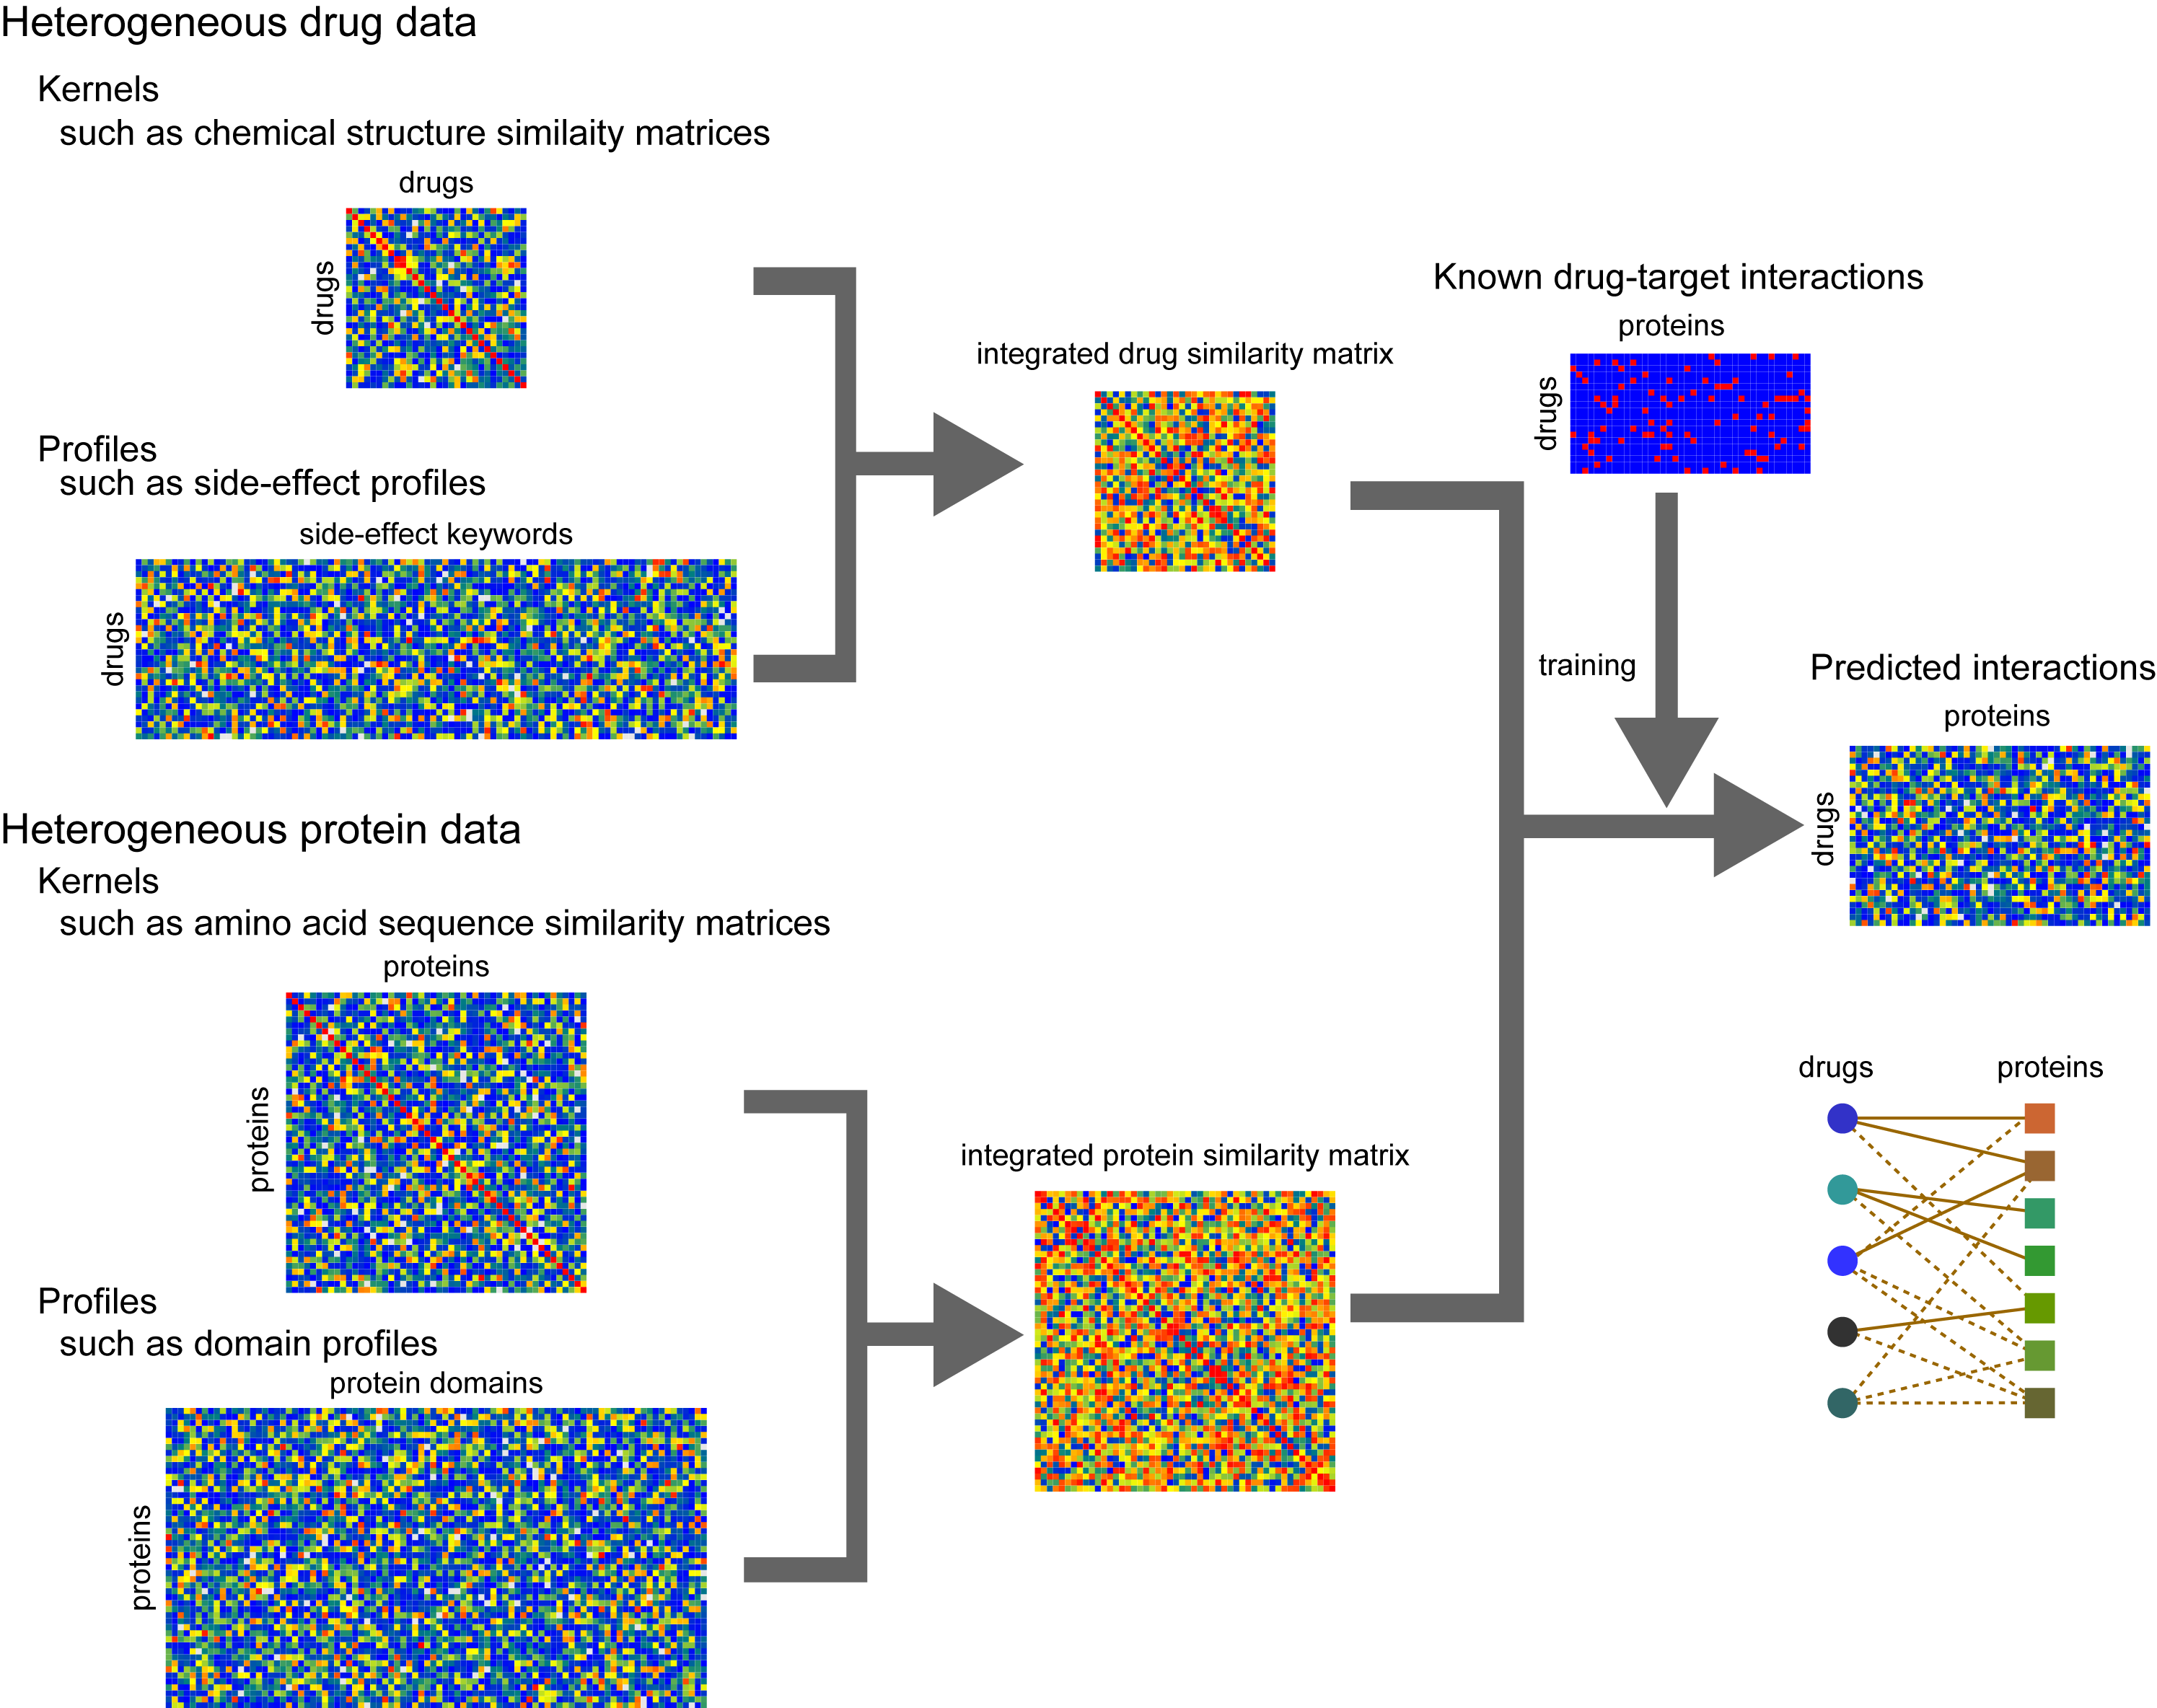
DINIES (Drug-target Interaction Network Inference Engine based on Supervised Analysis) enables us to predict potential interactions between drug molecules and target proteins, based on drug data (derived from various data such as chemical structures, previously reported side-effect information, etc) and omics-scale protein data (derived from various data such as sequence similarity, domain composition, expression profile, etc). The users can use any data as the input, as long as they are represented as the tab-delimited matrices or profiles.
Usage
The DINIES server provides two options: "DINIES Search" and "DINIES Prediction". DINIES Search enables users to explore comprehensively predicted drug-target interaction networks in the previous works. DINIES Prediction enables us to conduct a network prediction with user's own data. DINIES Prediction has two procedure modes: "Simple mode" and "Advanced mode". In the Simple mode, a network prediction is performed using a default method with default parameters. In the Advanced mode, a network prediction is performed using a user-preferred method with selected parameters under the detailed settings.
DINIES Search
- Input a drug name (e.g., Cathine), a drug ID in KEGG(e.g., D07627), a protein name (e.g., GABRA), a protein ID in KEGG (e.g., hsa:4988), a MOL file text, or a SMILES string.
Click on the "Drug or Target Search" button. - Select a prediction approach: "chemogenomic approach" or "pharmacogenomic approach". "chemogenomic approach" means that the prediction is performed based on drug chemical structure similarities and target protein sequence similarities. "pharmacogenomic approach" means that the prediction is performed based on drug side-effect similarities and target protein sequence similarities.
- Select a learning data: KEGG or all DBs. "KEGG" means that a training of a predictive model is learned on known drug-target interactions in KEGG only. "all DBs" means that a predictive model is learned on known drug-target interactions in many databases including KEGG, DrugBank, MATADOR, ChEMBL, PDSP Ki, and TTD.
- Change a threshold value for the prediction scores of drug-target pairs. Higher score (closer to 1) can be interpreted more reliable (high confidence), low score (closer to 0) can be interpreted less reliable (low confidence).
- If a query drug/compound is not in the pre-calculated drug-target interaction network, the list of structurally similar drugs on the network is displayed. Select one drug in the hit drug list. Or select one protein in the hit protein list in the case of a query protein.
Click on the "DINIES Search" button.
DINIES Prediction with Simple mode
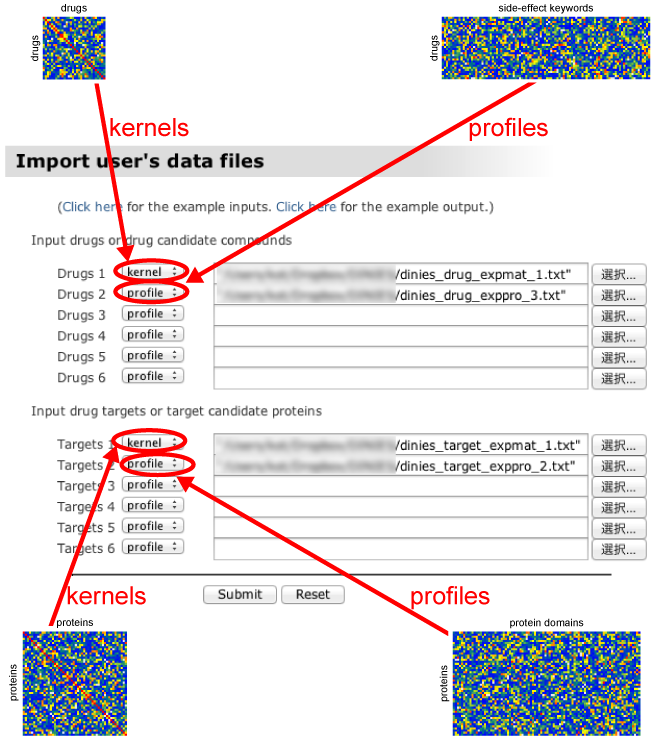
- Upload the data files (tab-delimited text file) for drugs or target proteins in the format of either "profile" matrix or "kernel" similarity matrix. See the next box for more detailed explanations about "profile" or "kernel".
- If the input data format is a profile matrix, please select "profile" in the pull-down menu. If the input data format is a similarity matrix, please select "kernel" in the pull-down menu.
Click on the "submit" button.
What are Profiles and Kernel matrices?
DINIES accepts tab-delimited text files as inputs, which must be in one of the forms of "profiles" or "kernel matrices" (kernels, in short).
"profile" is defined as an asymmetric matrix where the rows correspond to the objects of interest (drugs or proteins) and the columns corresponds to the features of the objects (chemical substructures, domains, etc). In the case of profile matrix, the 1st row represents the feature labels, and the 1st column represents the object labels.
"kernel" is defined as a symmetric matrix where the rows and columns both corresponds to the objects (drugs or proteins). In the case of kernel similarity matrix, the 1st row represents the object labels, and the 1st column represents the object labels. The number of rows and columns should be the same. Examples of the two data formats can be found here.
DINIES Prediction with Advanced mode
- Upload the data files (tab-delimited text file) for drugs or target proteins in the format of either "profile" matrix or "kernel" similarity matrix. See the above box for more detailed explanations about "profile" or "kernel". (As the same way as the Simple mode.)
- If the input data format is a profile matrix, please select "profile" in the pull-down menu. If the input data format is a similarity matrix, please select "kernel" in the pull-down menu.
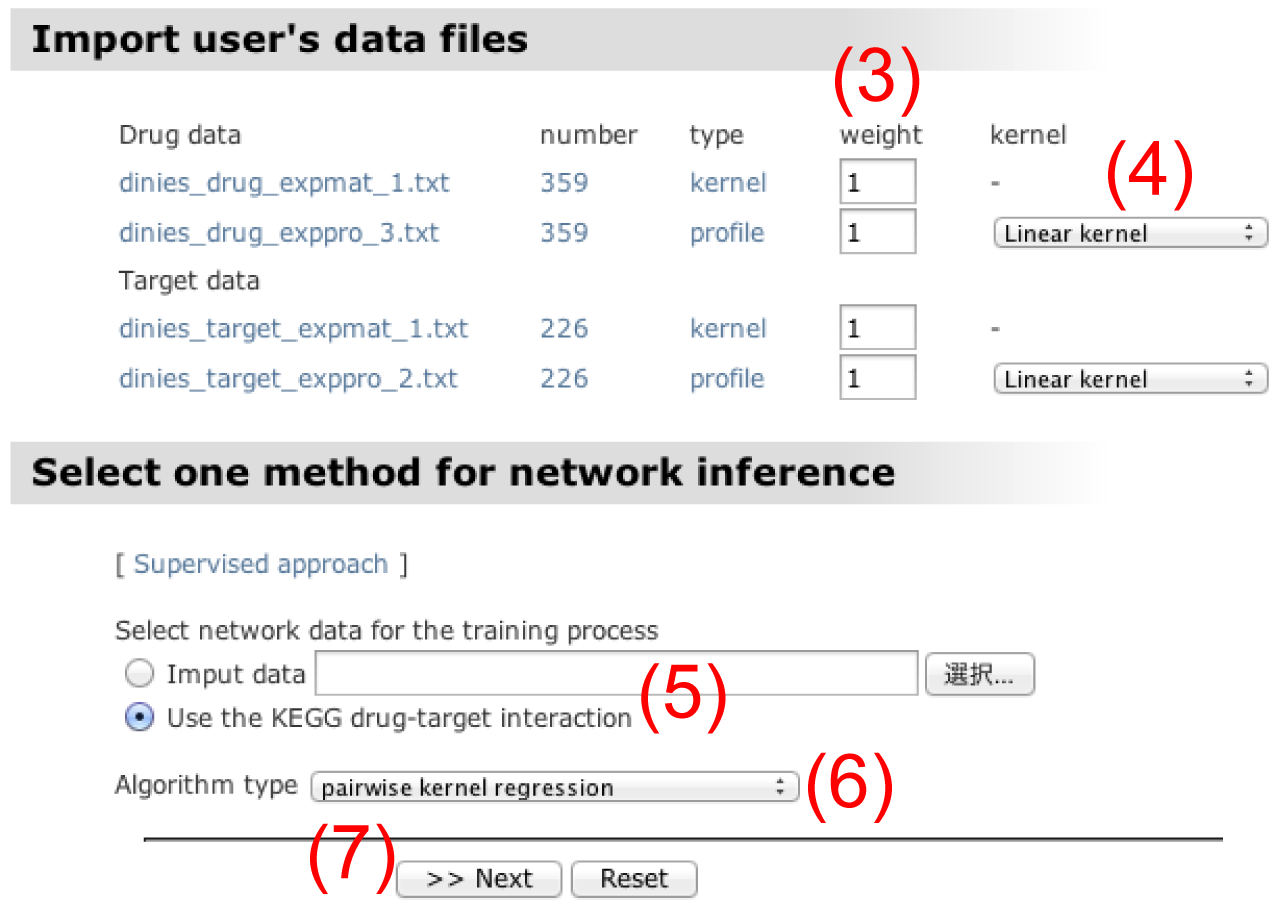
Click on the "next" button. - Assign weight to each dataset in the data integration process. The weight of 1 means the simple average of multiple kernel similarity matrices.
- Choose one kernel function for each dataset in the pull-down menu. The default is set to linear kernel, but Gaussian RBF kernel, Exponential kernel, and Polynomial kernel are available.
- Import a file of partially known drug-target interactions in the adjacency matrix format in order to learn a predictive model. Here the adjacency matrix is defined as a binary matrix whose rows correspond to drugs, columns correspond to target proteins, and elements are coded 1 (presence of interaction) or 0 (absence of interaction). The drug-target interaction data in KEGG can be used if custom data is not imported.
- Choose one algorithm type for supervised learning. "pairwise kernel regression" is a default because of computational efficiency, but "spectral decomposition and regression" and "distance metric learning" are also available. See more detailed explanations about properties of each method in the Methods section on the help page.
Click on the "next" button. - Put in kernel parameters if necessary. The width parameter for Gaussian RBF kernel and Exponential kernel and the degree parameter for Polynomial kernel can be changed.
Click on the "next" button. - Confirm all the parameters and experimental settings.
Click on the "submit" button.
Output
DINIES outputs the following four types of results: [ An example of the output page ]
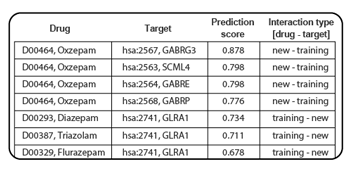
- Inferred list: All the predicted drug-target interaction pairs (above the prediction score threshold) are shown.
Each drug-protein pair is assigned a prediction score. Higher score (closer to 1) can be interpreted more reliable (high confidence), low score (closer to 0) can be interpreted less reliable (low confidence).
The predicted drug-target interaction pairs are categorized into (i) new drugs vs. new proteins, (ii) training drugs vs. new proteins, (iii) new drugs vs. training proteins, (iv) training drugs vs. training proteins and (v) all (including all the predicted interactions and known interactions), where 'training' and 'new' correspond respectively to presence and absence in the training interaction data. "known" in the all category means a known drug-target relationship in KEGG in the case of learning with KEGG or a known drug-target relationship in many compound-protein interaction databases including KEGG, DrugBank, MATADOR, ChEMBL, PDSP Ki, and TTD in the case of learning with all DBs.
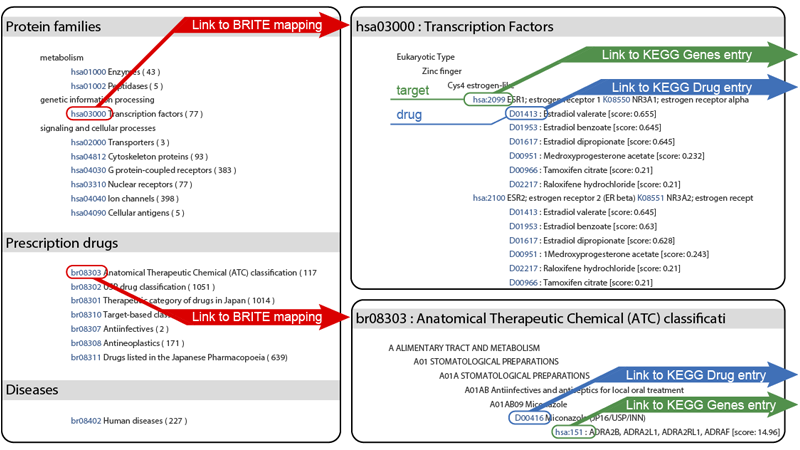
- BRITE mapping: All predicted drug-target interaction pairs are mapped to KEGG BRITE representing hierarchical knowledge classifications on various aspects of biological systems.
The predicted drug-target interaction pairs are grouped into many functional hierarchies in KEGG BRITE (e.g. protein families, drug ATC classes and human diseases). The list shows the associations of drugs/proteins in the inferred list with drugs/proteins in the hierarchical classifications. For example, if one of the protein families is selected, the drugs that are predicted to interact with proteins in the selected family will be highlighted.
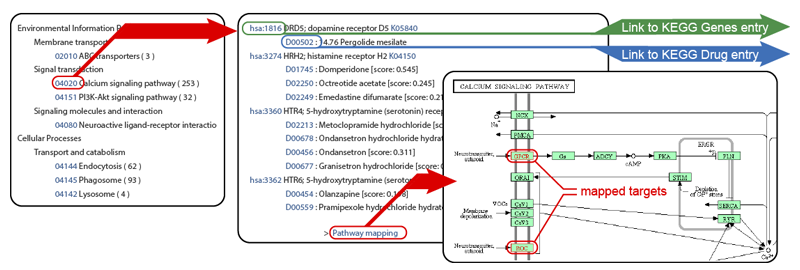
- Pathway mapping: All predicted drug-target interaction pairs are mapped to KEGG Pathway representing biological pathways and various molecular interaction networks.
The predicted interactions are grouped into many biological pathway maps in KEGG PATHWAY (e.g. signalling pathways, metabolic pathways). The list shows the associations of drug/proteins in the inferred list with drug/proteins in the biological pathways. For example, if one of the pathways is selected, drugs that are predicted to interact with proteins in the selected pathway will be highlighted.
- Details & Download: The prediction results can be updated with different parameters and the prediction results are downloadable.
The user can change the prediction score threshold to update the prediction results on the output page with the new threshold. The user can also change parameter values in the method (e.g., kernel parameters, weight parameters, method type) to re-calculate the prediction results with the new parameters. The last option, Download, provides a list of predicted drug–protein pairs downloadable as a tab-delimited text file, which can be viewed with network-visualising software such as Cytoscape.
Summary of prediction methods
DINIES implements three algorithms: i) pairwise kernel regression, ii) spectral decomposition and regression, and iii) distance metric learning. We make a brief review of each method. More detailed explanations can be found in the original papers.
- Pairwise kernel regression (PKR) was proposed in a previous work (Takarabe et al, Bioinformatics, 28, i611-i618, 2012).
The drug-target interaction prediction is formulated by supervised classification problem and solved by kernel regression for drug-protein pairs (pairwise kernel regression). The output of the pairwise kernel regression model is designed such that pairs in interaction class and non-interaction class correspond to positive scores and negative scores, respectively. If an interesting property of tensor-product for pairs is used, it can be solved in the matrix factorization framework. The prediction score is defined as an inner product between a drug and a target protein in the factorized feature space, which are normalized to 1 for the maximum and -1 for the minimum in the server. This is the most efficient among the three algorithms in terms of memory consumption and computational time, so PKR is set to the default method in DINIES. - Spectral decomposition and regression (SDR) was proposed in a previous work (Yamanishi et al, Bioinformatics, 24, i232-i240, 2008).
The method consist of the following two steps: First, two mappings are learned in order to embed drugs and target proteins into a low-dimensional unified Euclidean space representing the network topology, where interacting drugs and target proteins are close to each other. Then, the mappings are applied to any drugs and target proteins respectively, and predict new interactions between drugs and target proteins based on the closeness between mapped drugs and target proteins. The prediction score is defined as a cosine correlation coefficient between a drug and a target protein in the low dimensional feature space. - Distance metric learning (DML) was proposed in a previous work (Yamanishi et al, Advances in Neural Information Processing Systems 21, pp.1841-1848, MIT Press, Cambridge, MA, 2009).
The method consist of the following two steps: First, two mappings to a low dimensional feature space are learned by minimizing the sums of distances between interacting drugs and target proteins. Then, the mappings are applied to any drugs and target proteins respectively, and predict new interactions between drugs and target proteins based on the closeness between mapped drugs. The prediction score is defined as a cosine correlation coefficient between a drug and a target protein in the low dimensional feature space. The difference between SDR and DML is that SDR explicitly embeds drugs and target proteins in a unified feature space, while KDL implicitly embeds drugs and target proteins in a unified feature space.
There are two parameters in each of the above three methods: the number of components (the dimension of the underlying feature space) and regularization parameters (the trade-off between minimizing the loss and avoiding over-fitting).
The larger the number of components, the higher the model complexity. The larger the value of regularization parameter, the lower the model complexity.
Data file examples
Input data:
- Drug data 1 (file type: kernel; chemical structure similarity matrix of 300 drugs)
[ sample_Dsimmat_chemical.txt ] - Drug data 2 (file type: profile; 300 drugs x 11047 side-effects profile)
[ sample_Dprofile_sideeffect.txt ] - Target data 1 (file type: kernel; amino acid sequence similarity matrix of 200 proteins)
[ sample_Tsimmat_sequence.txt ] - Target data 2 (file type: profile; 200 proteins x 335 domains profile)
[ sample_Tprofile_domain.txt ]
Training data for supervised approach:
- Adjacency matrix of known drug-target interactions (200 known drugs x 150 known proteins)
[ sample_DTadmat.txt ]
Supplemental materials in the NAR paper
- > Predicted drug-protein pairs absent from the training KEGG data
- > Confirmed drug-protein pairs in DrugBank
- > Confirmed drug-protein pairs in MATADOR
- > Confirmed drug-protein pairs in ChEMBL
- > Confirmed drug-protein pairs in PDSP Ki
- > Confirmed drug-protein pairs in TTD
References